CELLCYCLE Example of gene expression profile analysis
Contents
Introduction
The yeast (Saccharomyces cerevisiae) is a unicellular fungus found naturally in grapevines and responsible of wine making fermenting sugars and producing alchool. In this example we show some methods used in gene expression analysis for the study of its general cell cycle. From being budded off from its parent cell, to reproducing its own offspring, each yeast go through a number of typical step that also involve changes in gene expression, turning whole pathways on and off. Today the study of such phenomena is possible through the technology of microarray that can measure the expression level of every gene in a cell. With the gene expression data, genes can be clustered on the basis of the similarity of their expression profiles. Here we examine the expressions of the entire yeast genome through two rounds of the cell cycle. The temporal expression of genes are measured by microarray at 24 time points every five hours. In detail we have the expression profile of about 6000 genes. The data set can be obtained from page of the project at Stanford:
web('http://cellcycle-www.stanford.edu/');
You can load the data directly into the MATLAB workspace
load cellcycle.mat
You can verify the real number of genes in the data set. The cell array ‘ccgene’ contains the name of all genes. There are 6178 genes.
numel(ccgene)
ans =

        6178
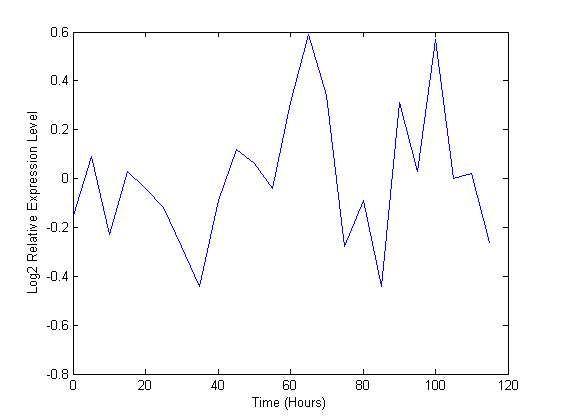
Let us analyze for example the first gene.
ccgene{1}
ans =

YAL001C
A plot shows the expression profile for this ORF
plot(time, ccvalues(1,:))
xlabel('Time (Hours)');
ylabel('Log2 Relative Expression Level');
Missing data
As frequently happens in this type of analysis, the original matrices used in that type of experiments have various entries with missing values. It is due to error of measurement or in the construction of the array. Here due to the high number of gene we simply remove those with missing values and those with low variability.
nanInd = any(isnan(ccvalues),2);
ccvalues(nanInd,:) = [];
ccgene(nanInd) = [];
numel(ccgene)
ans =

        4381
[mask, ccvalues, ccgene] = genelowvalfilter(ccvalues,ccgene,'absval',log2(3));
numel(ccgene)
ans =

   363
We use also the geneentropyfilter to remove genes whose profiles have low entropy:
[mask, ccvalues, ccgene] = geneentropyfilter(ccvalues,ccgene,'prctile',15);
numel(ccgene)
ans =

   309
Cluster analysis
In order to identify genes that vary within the cell cycle, we can cluster genes with the K-means clustering algorithm and select those clusters which have a temporal expression profile that goes up and down. We decide to use the K-means clustering algorithm. As distance measure between the data points we consider d=1-corr, where corr indicates the sample correlation between two data points. We set the number of clusters equal to 16 (arbitrary choice);
totalcluster = 16;
[clusters, ctrs] = kmeans(ccvalues, totalcluster, 'dist','corr', 'rep',5,...
                                                        'disp','final');
19 iterations, total sum of distances = 75.1584
12 iterations, total sum of distances = 75.5646
17 iterations, total sum of distances = 74.1309
12 iterations, total sum of distances = 74.3474
14 iterations, total sum of distances = 74.7224
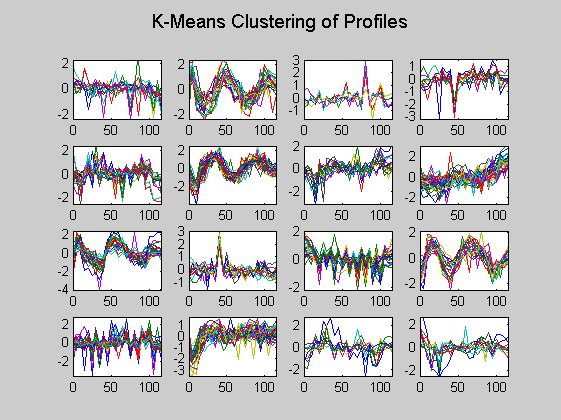
Here in each plot the gene profiles in the same cluster are plotted together.
figure
for c = 1:totalcluster
    subplot(4,4,c);
    plot(time,ccvalues((clusters == c),:)');
    axis tight
end
suptitle('K-Means Clustering of Profiles');
Then only the centroid profiles are plotted for each cluster so that the expression pattern can be examined more clearly.
figure
for c = 1:totalcluster
    subplot(4,4,c);
    plot(time,ctrs(c,:)');
    axis tight
    axis off    % turn off the axis
end
suptitle('K-Means Clustering of Centroid Profiles');
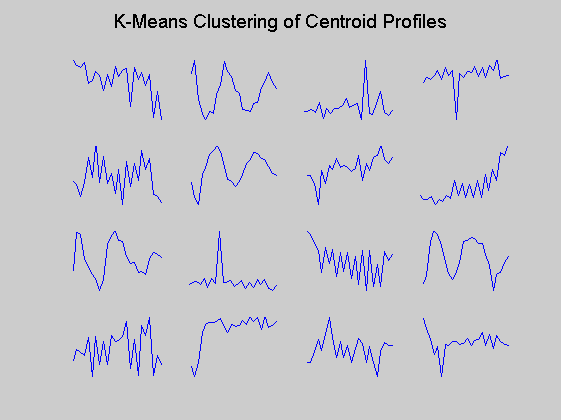
The last plot can be used to determine if a cluster contains periodic genes by comparing the center to periodic functions such as cosines of various frequencies and phases. We can check the degree of periodicity of each cluster centre
PER=zeros(totalcluster,10);
for c = 1:totalcluster
    for phase=1:10
        PER(c,phase)=(cos(time/0.9+phase)*ctrs(c,:)');
    end
end

[r,c]=find(PER>1.2);  %tuned threshold
periodic_clusters=unique(r)
periodic_clusters =

     2
     6
     9
    12
    14
    15
We outputed the clusters that look most periodic. To do that some arbitrary choice have been made: the period of the sinewave is arbitrarily fixed to 0.9, the phase is changed, the threshold for a signal to be considered periodic have been fixed to 1.2. We also identify all periodic genes.
periodic_genes=0;
for c = 1:size(periodic_clusters)
   clu=find(clusters==c);
   periodic_genes=union(periodic_genes,clu);
end
periodic_genes=setdiff(periodic_genes,0);

ccgene(periodic_genes)
ans =

    'YBL052C'
    'YBR038W'
    'YBR054W'
    'YBR092C'
    'YBR138C'
    'YBR158W'
    'YBR202W'
    'YBR301W'
    'YCR024C-A'
    'YCR089W'
    'YDL037C'
    'YDL039C'
    'YDL056W'
    'YDL074C'
    'YDL127W'
    'YDL234C'
    'YDR033W'
    'YDR038C'
    'YDR141C'
    'YDR205W'
    'YDR249C'
    'YDR409W'
    'YEL028W'
    'YER037W'
    'YER115C'
    'YFL011W'
    'YFL027C'
    'YFL039C'
    'YFL064C'
    'YFR002W'
    'YGL008C'
    'YGL013C'
    'YGL116W'
    'YGR044C'
    'YHL028W'
    'YHL036W'
    'YHR005C'
    'YHR036W'
    'YIL131C'
    'YJL051W'
    'YJL079C'
    'YJL131C'
    'YJL159W'
    'YJL194W'
    'YJR106W'
    'YJR138W'
    'YKL108W'
    'YKL163W'
    'YKL164C'
    'YKL185W'
    'YKR053C'
    'YLL023C'
    'YLL033W'
    'YLR049C'
    'YLR079W'
    'YLR122C'
    'YLR190W'
    'YLR194C'
    'YLR274W'
    'YLR438W'
    'YML046W'
    'YML052W'
    'YML058W'
    'YMR001C'
    'YMR031C'
    'YMR032W'
    'YMR203W'
    'YMR279C'
    'YMR310C'
    'YNL058C'
    'YNL065W'
    'YNL080C'
    'YNL160W'
    'YNR067C'
    'YNR068C'
    'YOL006C'
    'YOR025W'
    'YOR066W'
    'YOR159C'
    'YOR256C'
    'YOR298W'
    'YOR308C'
    'YPL061W'
    'YPL075W'
    'YPL132W'
    'YPL154C'
    'YPR119W'
    'YPR149W'
    'YPR203W'
    'YPR204W'
References
P.T. Spellman, G. Sherlock, M.Q. Zhang, V.R. Iyer, K. Anders, M.B. Eisen, P.O. Brown, D. Botstein, B. Futcher, Comprehensive Identification of Cell Cycle-regulated Genes of the Yeast Saccharomyces cerevisiae by Microarray Hybridization. Molecular Biology of the Cell 9, 3273-3297, 1998.