EYELESS Example of sequence alignment with MATLAB
This example shows how to perform global and local alignments of sequences and how to assess their significance.
Contents
Introduction
This demonstration compare the gene eyeless of Drosophila Melanoganster with the human gene aniridia. They are master regulatory genes producing proteins that control large cascade of other genes. Certain segments of genes eyeless of Drosophila melanogaster and human aniridia are almost identical. The most important of such segments encodes the PAX (paired-box) domain, a sequence of 128 amino acids whose function is to bind specific sequences of DNA. Another common segment is the HOX (homeobox) domain that is thougth to be part of more than 0.2% of the total nummber of vertebrate genes.
Compare the HOX domain
Here we compare the HOX domain of human and fly. The peptide sequences can be obtained from the GenBank database using getgenPept to download the data from the NCBI site. First read the human protein information into MATLAB.
human = getgenPept('AAD01939','SequenceOnly',true);
Then look at the Drosophila protein (GenBank accession number X79493).
fly = getgenPept('AAQ67266','SequenceOnly',true);
If you don’t have a live web connection, you can load the data from a MAT-file using the command
%load HOX % <== Uncomment this if no live connection.
A first comparison and Global Alignment
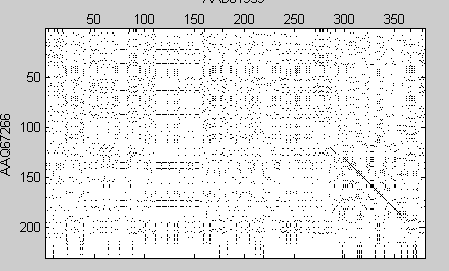
The first thing that to do is to use seqdotplot to see if there are any areas that are clearly aligned. This shows a region of alignments in the last parts of sequences.
seqdotplot(human,fly)
xlabel('AAD01939');ylabel('AAQ67266');
You can try a global alignment using the function nwalign. The BLOSUM50 scoring matrix is used by default. However other scoring matrix can be used.
[sc50,globAlig50] = nwalign(human,fly);
fprintf('Score = %g \n',sc50)
Score = -203.333
There score of the alignment is very low. Therefore you can try a better scoring matrix: the BLOSUM30.
[sc30,globAlig30] = nwalign(human,fly,'scoringmatrix','blosum30');
fprintf('Score = %g \n',sc30)
Score = -107.8
You can also specify the penalties for opening and extending a gap in the alignment. Here they are both set to 5.
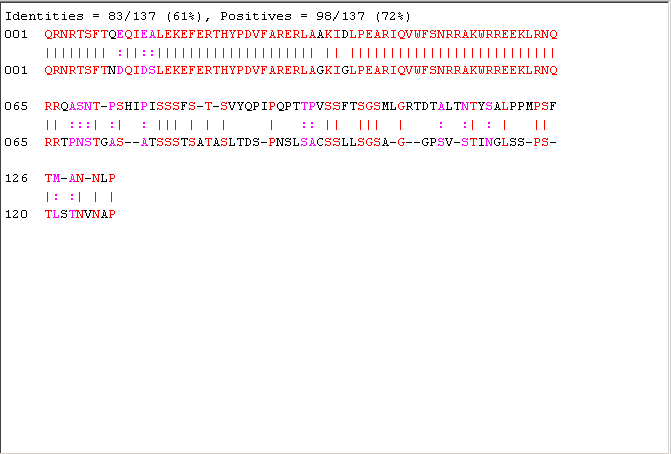
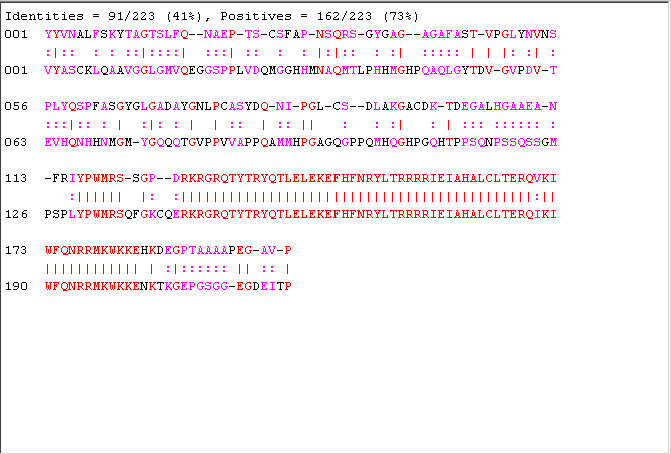
[sc30,globAlig30] = nwalign(human,fly,'scoringmatrix','blosum30','gapopen',5,'extendgap',5);
fprintf('Score = %g \n',sc30)
showalignment(globAlig30);
Score = 5
This gives an alignment that has some areas of similarity but is this alignment statistically significant? One way to investigate whether this score is significant is to use Monte Carlo techniques. It is reasonable to expect that the score for a statistically significant alignment is higher than the scores obtained from aligning random sequences of amino acids to the protein.
Assessing the significance of the score
To assess if the score is significant the first step is to make some random sequences that are similar to that of the fly protein. One way to do this is to take random permutations of the fly sequence. This can be done with the randperm function. Then calculate the global alignment of these random sequences against the human protein and look at the statistical significance of the scores.
n = 50;
globalscores = zeros(n,1);
flyLen = length(fly);
for i = 1:n
    perm = randperm(flyLen);
    globalscores(i) = nwalign(human,fly(perm),'scoringmatrix','blosum30','gapopen',5,'extendgap',5);
end
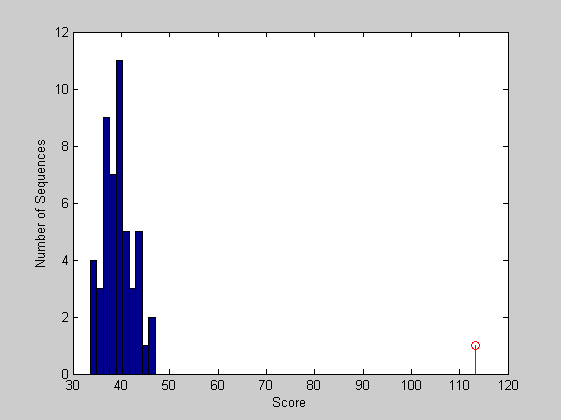
The scores of the alignments to the random sequences can be plot as a bar chart and can be visualized together with the score of the original sequence.
figure
buckets = ceil(n/5);
hist(globalscores,buckets)
hold on;
stem(sc30,1,'k')
xlabel('Score'); ylabel('Number of Sequences');
hold off;
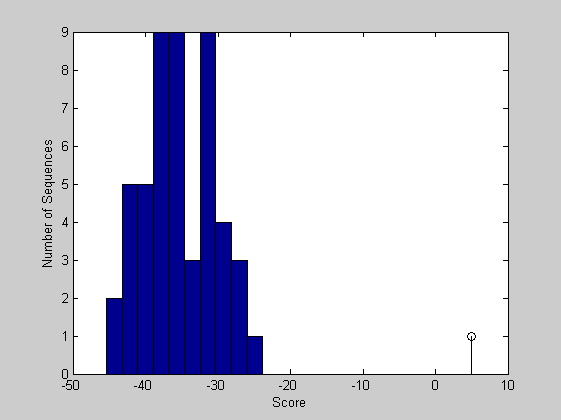
From this plot you can see that the global alignment is statistically significant.
Using Local Alignment and randseq
You will now repeat the process of estimating the significance of an alignment this time using local alignment and a slightly different method of generating the random sequences. Instead of simply permuting the letters in the sequence, an alternative is to draw a sequence from a multinomial distribution which is estimated from the fly protein sequence. You can do this using the aacount and randseq functions; the first estimates the amino acid frequencies of the query sequence and the later randomly creates new sequences based on this distribution.
[lscore,locAlig] = swalign(human,fly,'scoringmatrix','blosum30','gapopen',5,'extendgap',5);
fprintf('Score = %g \n',lscore)
showalignment(locAlig);

localscores = zeros(n,1);
aas = aacount(fly);
for i = 1:n
    randProtein = randseq(flyLen,'FROMSTRUCTURE',aas);
    localscores(i) = swalign(human,randProtein,'scoringmatrix','blosum30','gapopen',5,'extendgap',5);
end
Score = 113.2
We now plot the bar chart of the scores.
figure
hist(localscores,buckets)
xlabel('Score');
ylabel('Number of Sequences');
hold on;
stem(lscore,1,'r')
hold off;
Again the local alignment appears to be statistically significant.
Looking at PAX genes
You can consider also the coding regions of the PAX genes previously discussed. Since the eukaryotic genes often contain introns, you can get the sequences of just the mRNA from the GenBank database using getgenbank to download the data from the NCBI site. First read the human sequence into MATLAB.
human = getgenbank('AY707088','SequenceOnly',true);
The nucleotide sequence must be converted into the protein sequence. Use the nt2aa function to do this.
humanProtein = nt2aa(human);
Then look at the Drosophila (GenBank accession number NM_001014694).
fly_all = getgenbank('NM_001014694');
Warning: Problems reading the GenBank data. The structure may be incomplete.
Since we look for the gene eyeless we consider only the coding sequence.
%fly=fly_all.Sequence(fly_all.CDS.indices(1):fly_all.CDS.indices(2)-1);
Then the nucleotide sequence is converted to the protein one.
%flyProtein = nt2aa(fly);
If you don’t have a live web connection, you can load the data from a MAT-file using the command
load eyeless % <== Uncomment this if no live connection.
Global alignment
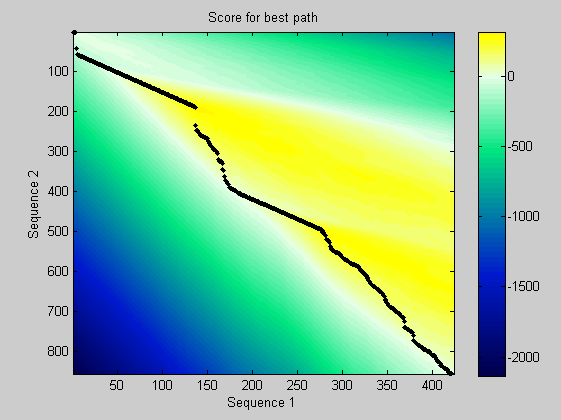
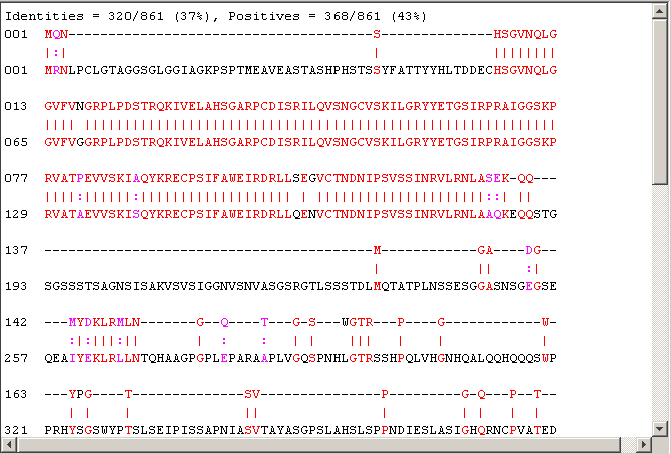
Repeat the process of generating a global alignment and then using random permutations of the amino acids to estimate the significance of the global alignment. The global alignment is performed using the PAM50 substitution matrix. Here you can see both the PAX and HOX domain. The dynamic programming matrix and the best path are also depicted.
[score,alignment] = nwalign(humanProtein,flyProtein,'scoringmatrix','pam50','SHOWSCORE', true,'gapopen',5,'extendgap',5);
fprintf('Score = %g \n',score)
showalignment(alignment);
globalscores = zeros(n,1);
flyLen = length(flyProtein);
for i = 1:n
    perm = randperm(flyLen);
    globalscores(i) = nwalign(humanProtein,flyProtein(perm),'scoringmatrix','pam50','gapopen',5,'extendgap',5);
end
Score = -0.5
The score of the alignment is fairly low. Anyway you can look at its significance.
figure
buckets = ceil(n/5);
hist(globalscores,buckets)
title('Determining Alignment Significance using Monte Carlo Techniques');
xlabel('Score');
ylabel('Number of Sequences');
hold on;
stem(score,1,'c')
hold off;
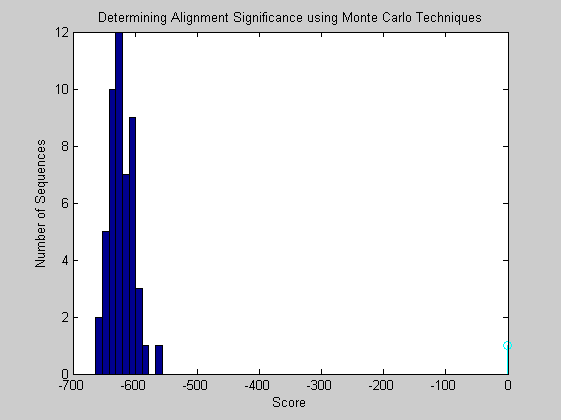
It appears that the alignment is statistically significant.
Using Local Alignment and randseq
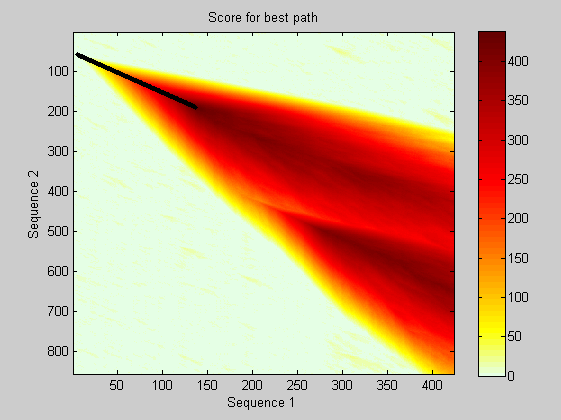
As above, you will repeat the process of performing local alignment and estimating the significance with randomly generated sequences. Here the Smith-Waterman algorithm is performed using the PAM50 substitution matrix. The dynamic programming matrix and the best path are also depicted.
[lscore,locAlig] = swalign(humanProtein,flyProtein,'scoringmatrix','pam50','SHOWSCORE', true,'gapopen',5,'extendgap',5);
fprintf('Score = %g \n',lscore)
showalignment(locAlig);

localscores = zeros(n,1);
aas = aacount(flyProtein);
for i = 1:n
    randProtein = randseq(flyLen,'FROMSTRUCTURE',aas);
    localscores(i) = swalign(humanProtein,randProtein,'scoringmatrix','pam50','gapopen',5,'extendgap',5);
end
Score = 437.5
We again plot the scores in the bar chart.
figure
hist(localscores,buckets)
xlabel('Score');
ylabel('Number of Sequences');
hold on;
stem(lscore,1,'r')
hold off;
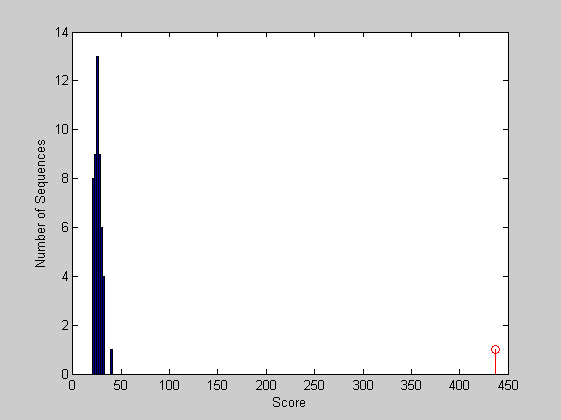
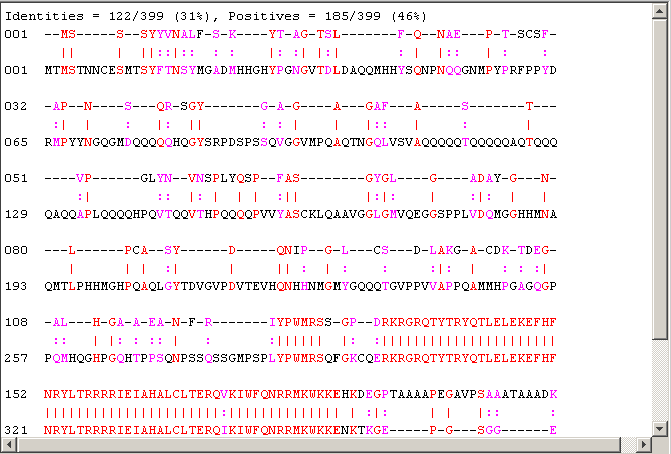
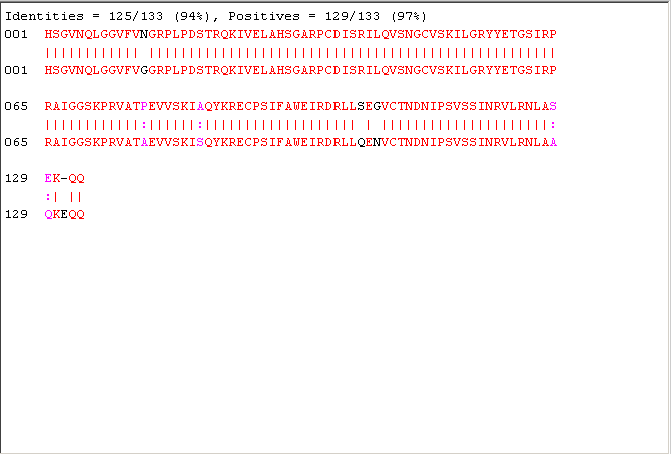
The local alignment is statistically significant. The sequence is found to correspond to the PAX domain. However the sequences have also a second common element, the homeobox, not found in the alignment because is too short. If you want to find it you can run a local alignment considering the last part of the sequences.
HumLength=length(humanProtein);
FlyLength=length(flyProtein);
[lscore,locAlig] = swalign(humanProtein(floor(HumLength/2):HumLength)...
    ,flyProtein(floor(FlyLength/2):FlyLength),'scoringmatrix','pam50','gapopen',5,'extendgap',5);
fprintf('Score = %g \n',lscore)
showalignment(locAlig);
Score = 233.5