CHLOROPLAST Example of sequence statistics and phylogenetic analysis
Contents
Introduction
This demonstration investigates the relationships among plants and cyanobacteria based on nucleotide and amino acid sequences of the protein ribulose 1,5-biphosphate carboxylase (RubisCo) large subunit. In plants, the large subunit of Rubisco is encoded by genes in the chloroplast. This demo analyzes the characteristics of Rubisco genes in plant chloroplasts and in several cyanobacteria. Chloroplasts in fact are believed to have arisen from an ensymbiotic relationship between a eukaryotic precursor and a cyanobacteria, the engulfed cyanobacteria becoming chloroplats.
Nucleotide sequences for Rubisco were obtained from chloroplast and cyanobacteria genomes from GenBank database and saved as FASTA files. The first file contains specific nucleotide sequences obtained from 36 photosyntetic eukaryotes. This includes algae, ferns, club mosses, monocotyledons, dycotyledons (angiosperms and gymnosperms), thus representing much of the range of complexity and evolutionary history of plans. A second file instead contains sequences from 7 photosyntetic prokaryotes. It is necessary to have these files on your local drive to run this demo.
Euc=fastaread('eukaryotes.fasta');

n1=length(Euc)

Proc=fastaread('prokaryotes.fasta');

n2=length(Proc)


All=Euc;
for i=1:n2
    All(i+n1).Sequence=Proc(i).Sequence;
    All(i+n1).Header=Proc(i).Header;
end

ntot= n1+n2;
n1 =

    36


n2 =

     7
Sequence Statistics
In this section simple comparative statistics and plots are generated. First of all, the lengths of all the nucleotide sequences are computed and compared through histogram.
for i = 1:ntot
    SeqLength(i) = length(All(i).Sequence);
end


hist(SeqLength)
title('Frequency of Nucleotide Sequence Lengths')
ylabel('Frequency')
xlabel('Number of Nucleotides')
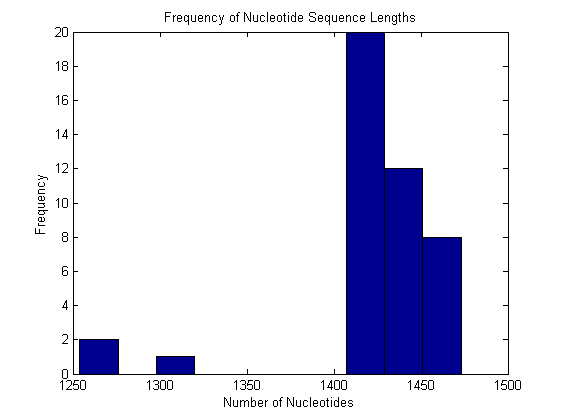
The length of the Rubisco gene ranged from 1,254 base pairs in the cyanobacteria R. etli to 1,473 base pairs in O. sinensis, a diatom. Notably, red algae and cryptomonads also had long nucleotide sequences (1,467 base pairs). Green plants had shorter sequences, most commonly 1,428 base pairs. The cyanobacteria had more variable sequence lengths ranging from 1,254 base pairs to 1,431 in Nostoc sp. Notably, the four cyanobacteria species (S. elongates, Synechoccus sp., Procholorococcus marinus, and Nostoc sp.) had sequence lengths closest to those of chloroplasts.
The nucleotide composition of each sequence is analysed. The MATLAB function basecount is used. Then the CG content of each species is calculated from that.
for i = 1 : ntot
    BC(i) = basecount(All(i).Sequence);
end

for i = 1 : ntot
    CG(i)=(BC(i).G+BC(i).C)/SeqLength(i);
end
The CG content is quite variable ranging from 37.5% to 53.2% among eukaryotes and from 48.7% to 65.3% among cyanobacteria.
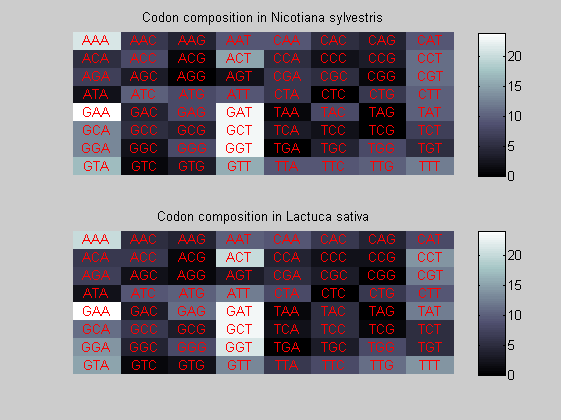
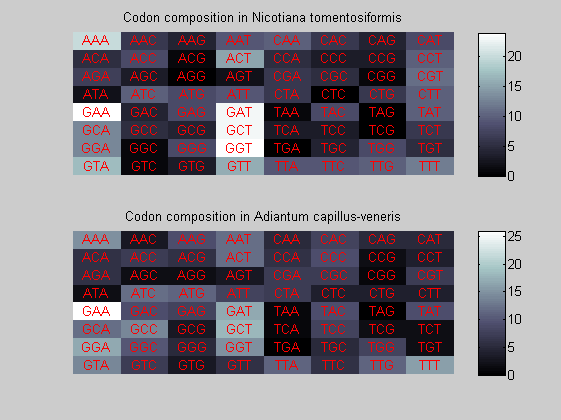
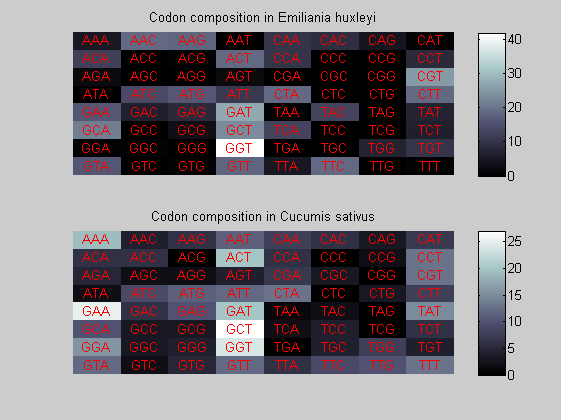
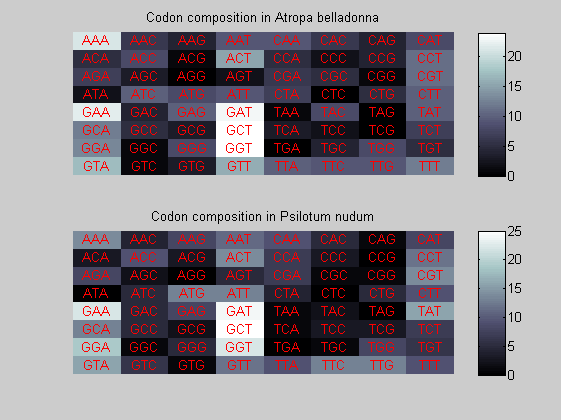
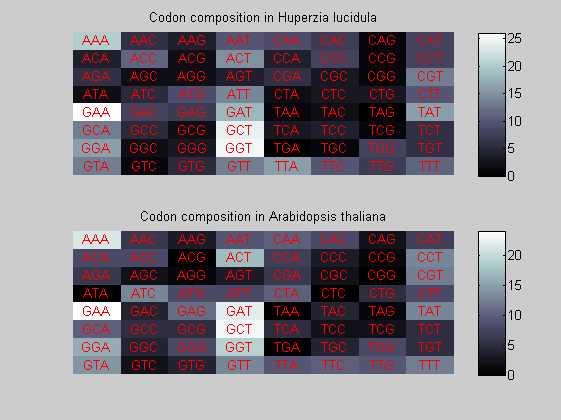
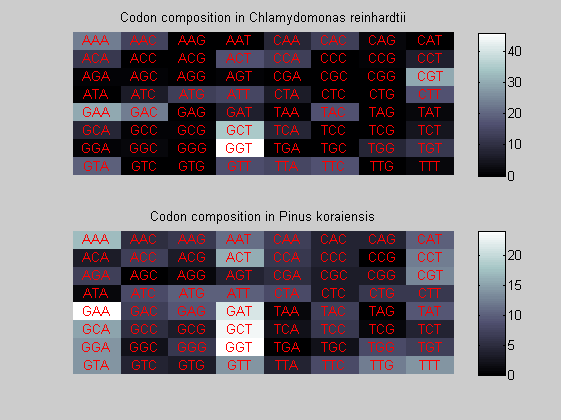
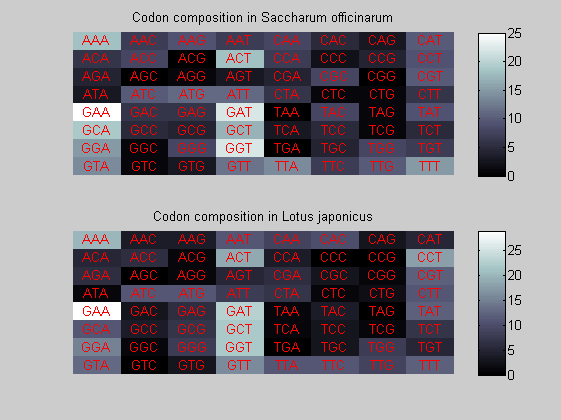
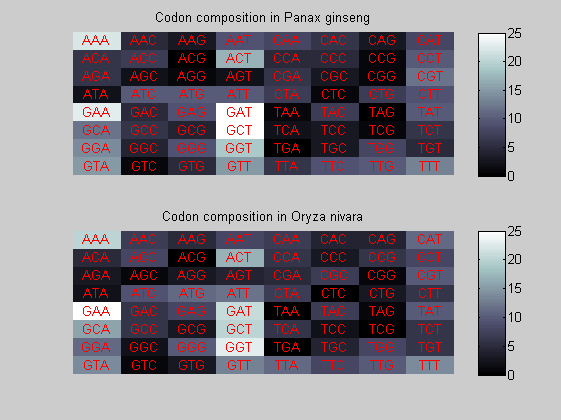
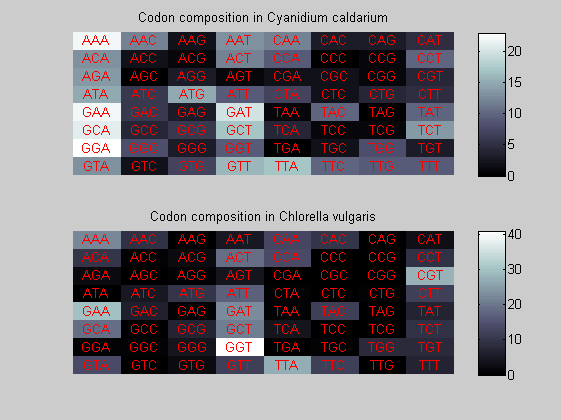
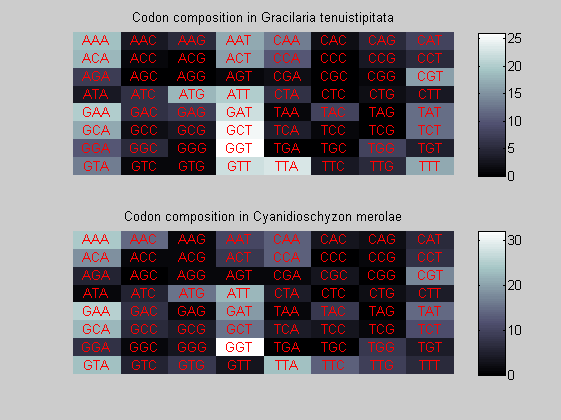
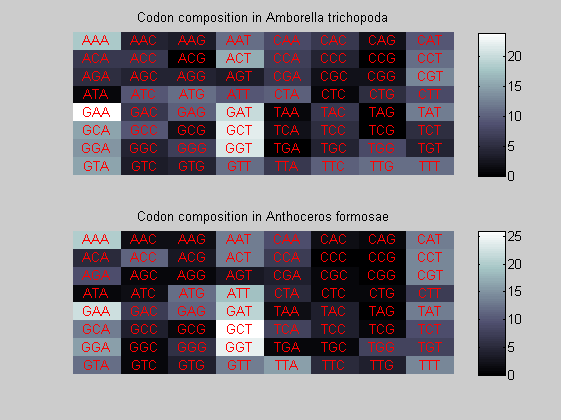
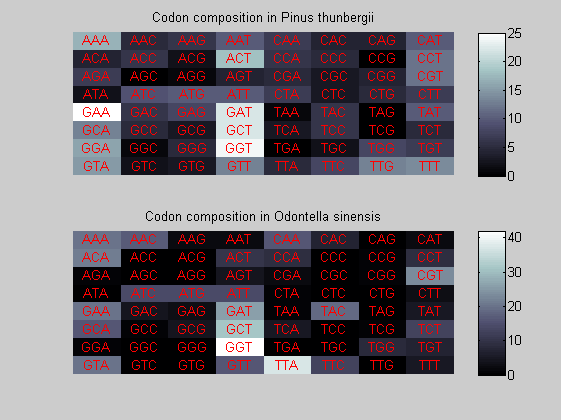
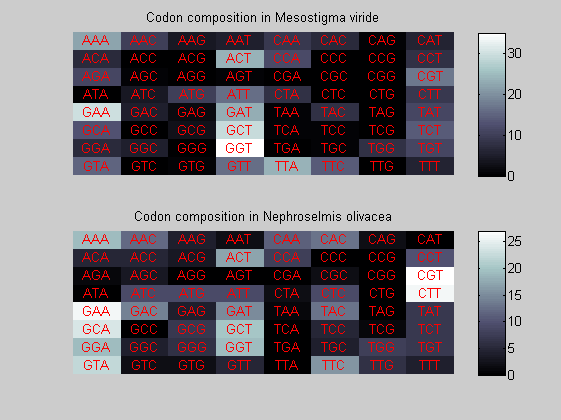
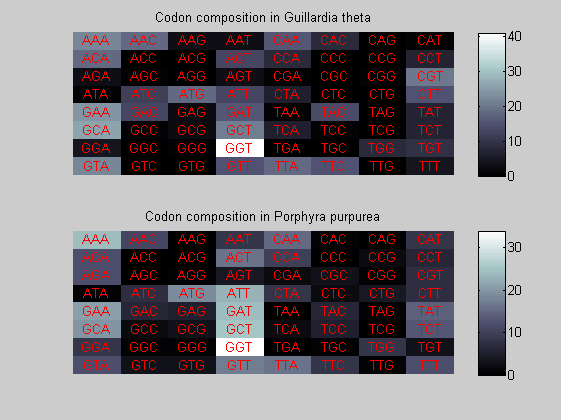
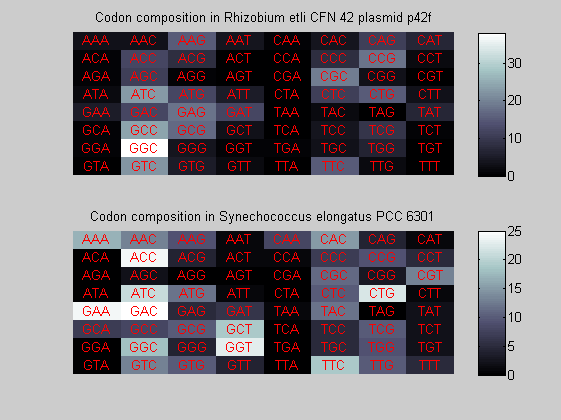
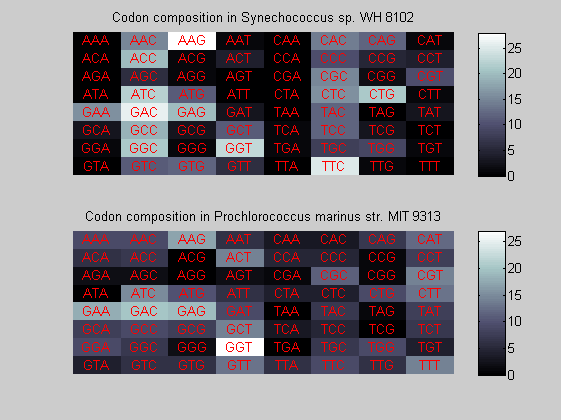
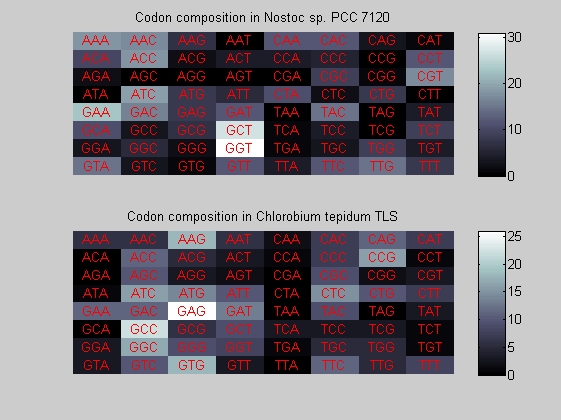
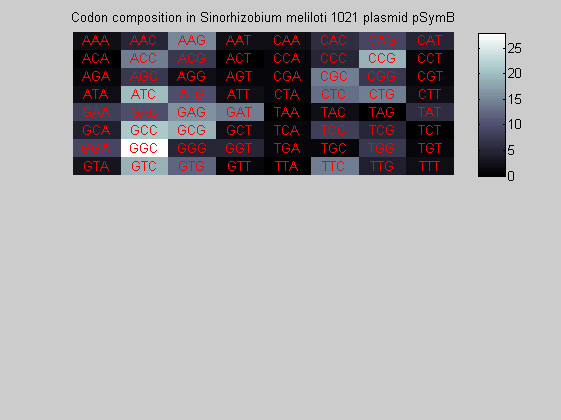
We consider the codons of each specie and generate plots of codon counts. The MATLAB function codoncount is used to this aim. In general in eukaryotic green plant there are high levels of GAA, GAT, GGT, GCT. Whitin the non green eukayotes. GGT typically remain at high levels, but with lower frequencies for the other 3 codons. Exceptions are G.tenuistipata, a cryptomonad which has high levels of GCT as well, and C.caldarium, a red algae which shows high levels of GAA and GAT but not of GGT. The cyanobacteria show little symilarity in codon count within the group or with eukaryotes. The most important similarity are that P.marinus and Nostoc sp. both have high levels of GGT and R.etli and S.melioti have high levels of GGC.
for i=1:ntot
    if rem(i,2)==1
        figure
        subplot(2,1,1);
    else
        subplot(2,1,2);
    end
    codoncount(All(i).Sequence, 'FIGURE', true);
    title(['Codon composition in ', All(i).Header]);
end


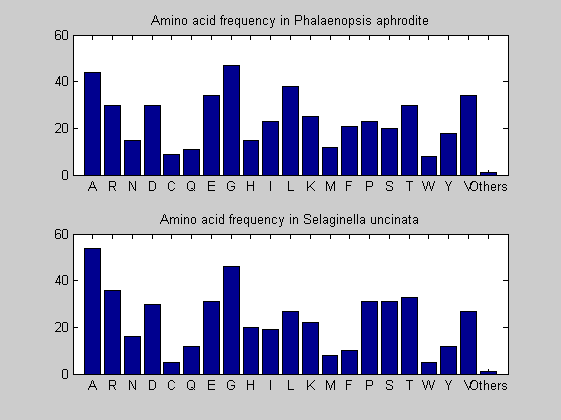
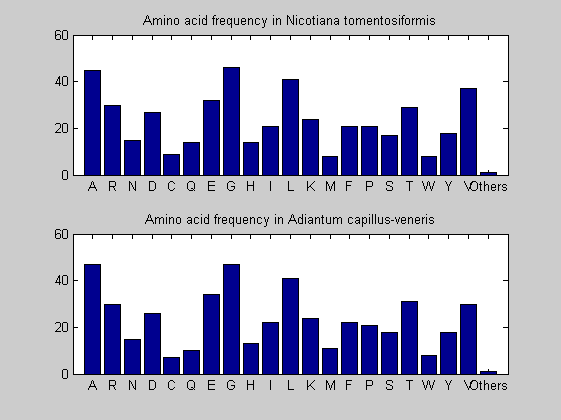
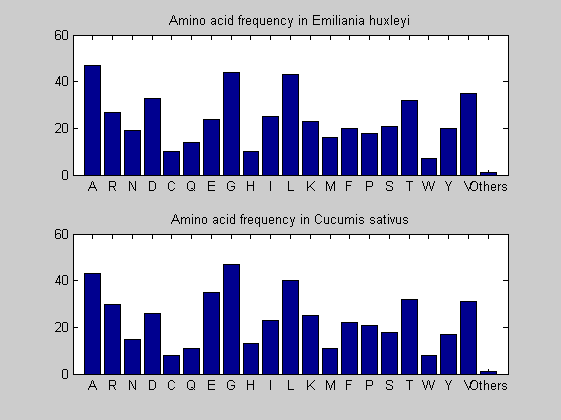
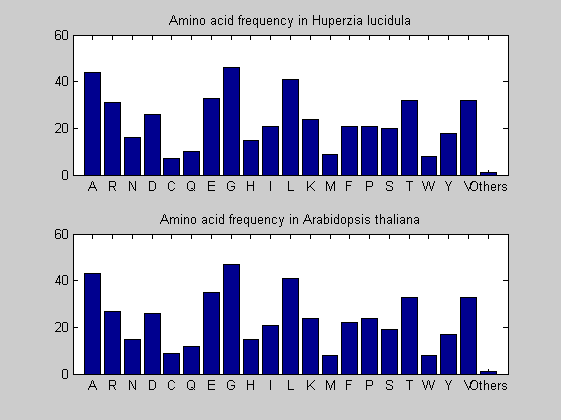
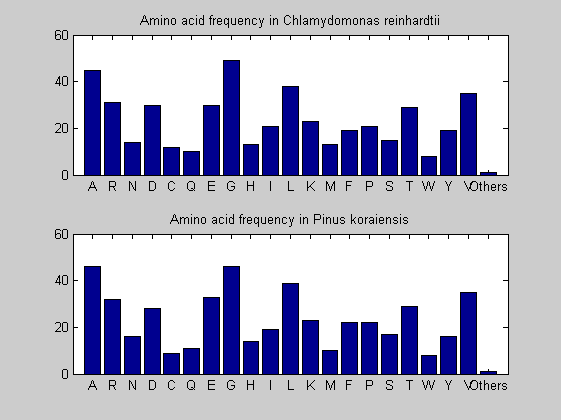
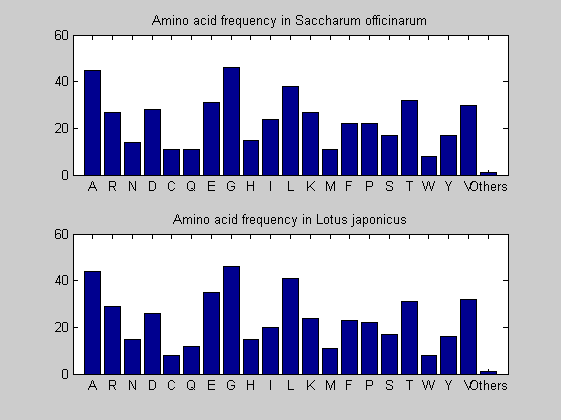
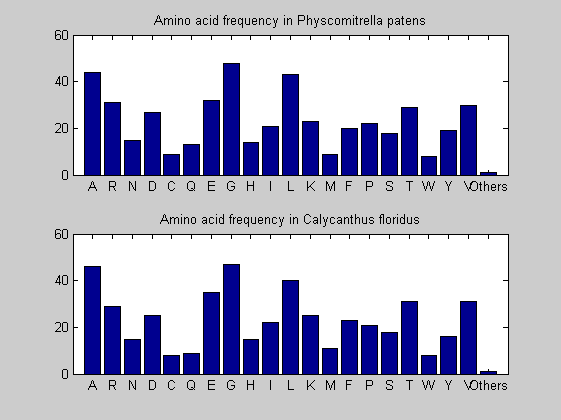
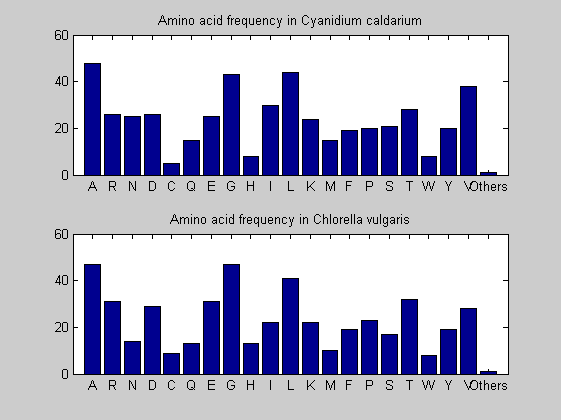
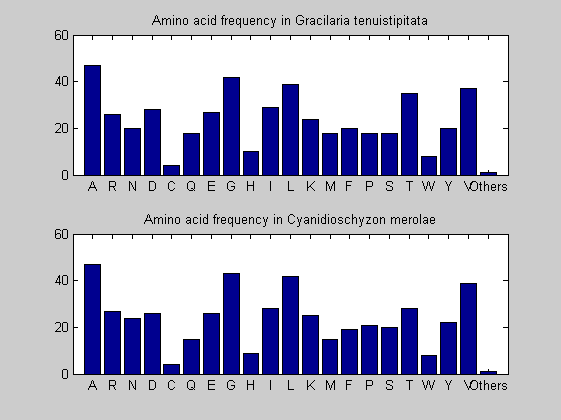
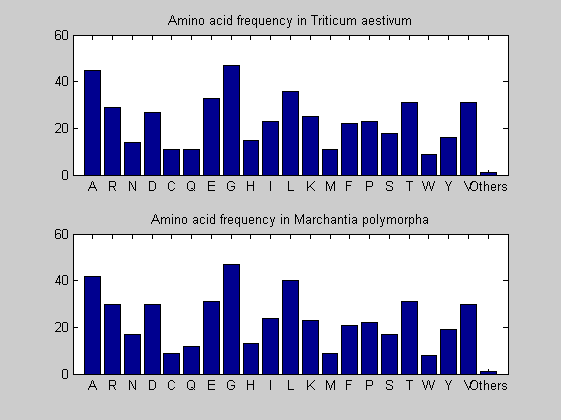
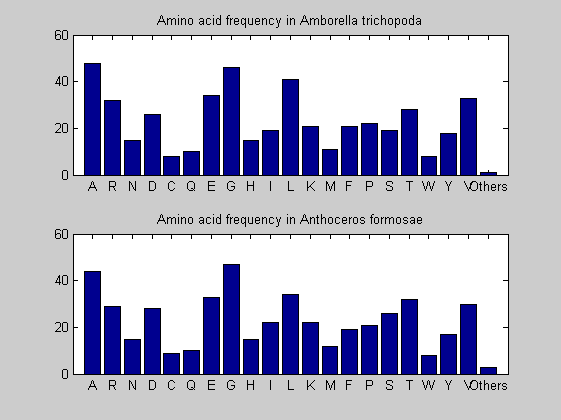
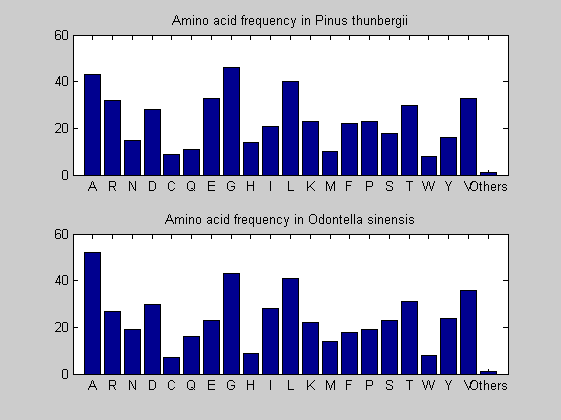
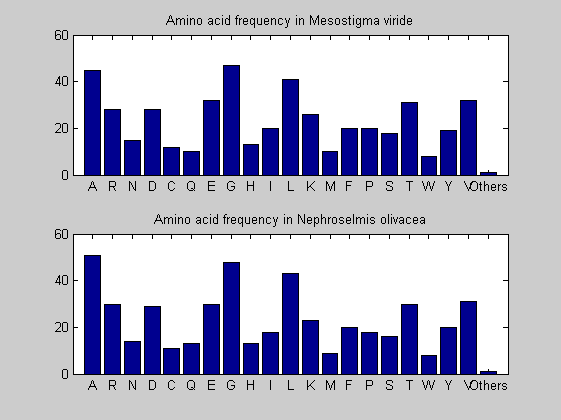
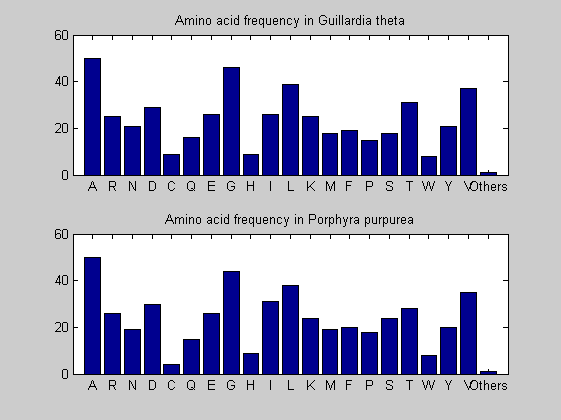
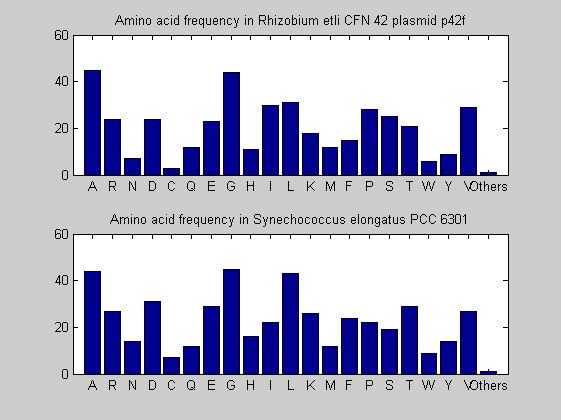
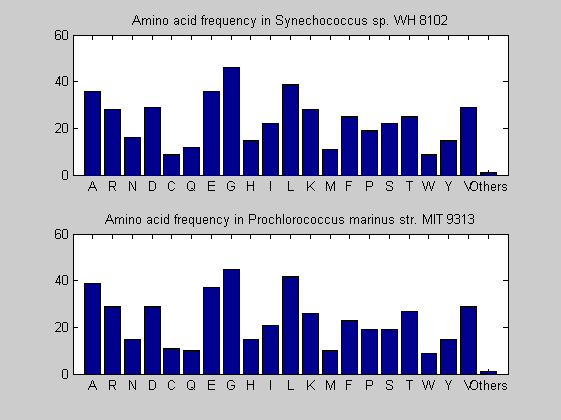
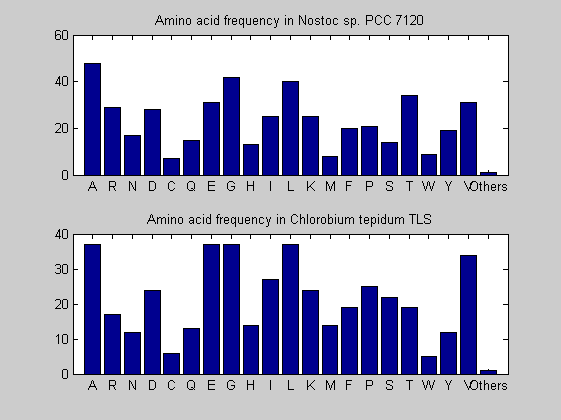
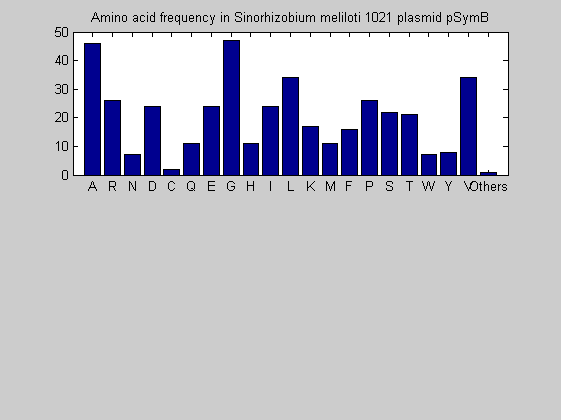
Then the composition of aminoacids is investigated by means of histograms. They show that alanine, glutamate, leucine, glycine, arginine and valine are typically the most abundant amino acids in green eukaryotes. Non-green eukaryotes instead have less abudance of glutamate and more of isoleucine. The amino acid frequency of cyanobacteria is similar to the eukaryotes. Some of them tend to have a certain abundance of glutamate.
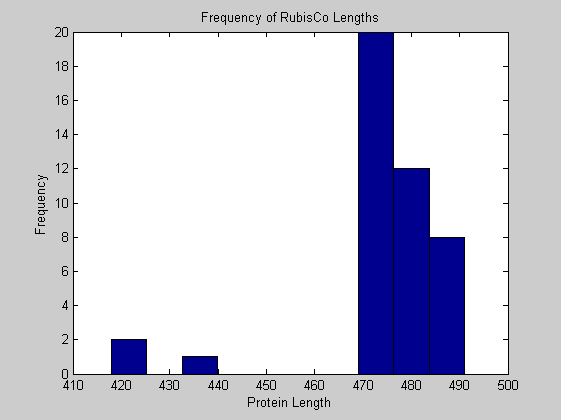
for i = 1:ntot
    SeqAA(i).Header = All(i).Header;
    if i<=n1
        SeqAA(i).Sequence=nt2aa(All(i).Sequence);
    else
        SeqAA(i).Sequence=nt2aa(All(i).Sequence,'GENETICCODE', 11);
    end
end

for i = 1:ntot
    ProtLength(i) = length(SeqAA(i).Sequence);
end

figure
hist(ProtLength)
title('Frequency of RubisCo Lengths')
ylabel('Frequency')
xlabel('Protein Length')

for i=1:ntot
    if rem(i,2)==1
        figure
        subplot(2,1,1);
    else
        subplot(2,1,2);
    end
    aacount(SeqAA(i).Sequence, 'chart','bar');
    title(['Amino acid frequency in ', SeqAA(i).Header]);
end


Alignments
Multiple alignment between all nucleotide sequences is performed. The MATLAB function multialign is used for that. The resulting alignment is also shown. Note that this part of the demo is quite slow.
alignNT=multialign(All);


showalignment(alignNT);
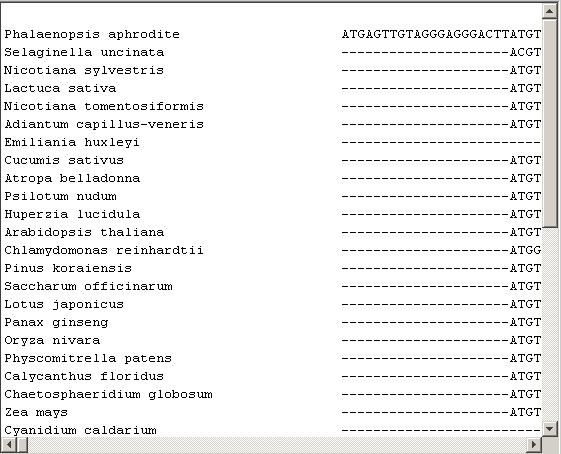
The alignment shows large areas of conserved sequences. Green eukaryotes have the most and the largest sequence in common with respect to non-green eukaryotes and cyanobacteria.
All possible pair-wise local alignments of nucleotide sequences are performed and scores of each are computed and compared.
sP=zeros(ntot,ntot);
for i=1:ntot
    for j=i:ntot
        [sP(i,j) align]=swalign(All(i).Sequence,All(j).Sequence, 'ALPHABET', 'NT');
    end
end
For eukaryotes pair-wise scores are very high and some exceed 1000. Low scores between eukaryotes occur when one member of the pair is green eukaryotes and the other non-green. The lowest scores is seen between some of the cyanobacteria and eukaryotes, specifically R.etli, C.tepidum and S.melioti. Scores greater than 1000 are observed between the Nostoc sp. and 22 of the 36 eukaryotes. Also S.elongates, Synechoccus sp. and P. marinus have high scores with eukaryotes.
Phylogenetic analysis
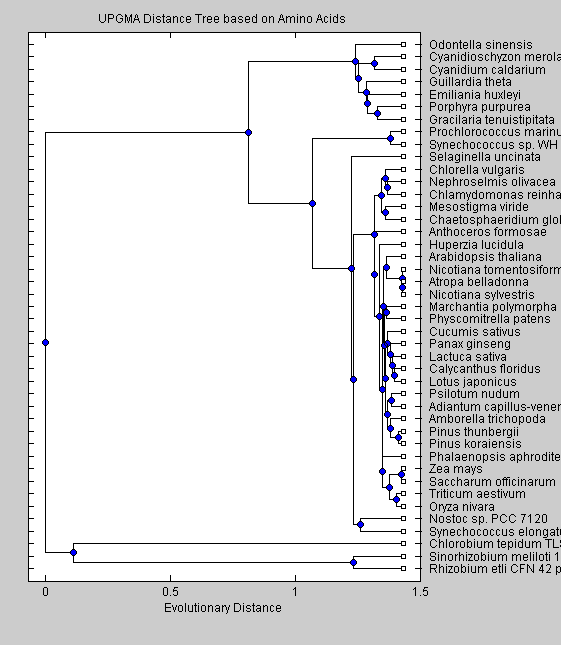
Evolutionary relationship are assessed using phylogenetic trees based on nucleotide and amino acid sequences. The trees are generated with the UPGMA and the neighbor joining algorithm. The distance matrix is computed with the Jukes-Cantor correction.
AAdist = seqpdist(SeqAA);
AAUTree = seqlinkage(AAdist, 'UPGMA', SeqAA);
plot(AAUTree)
title('UPGMA Distance Tree based on Amino Acids ')
xlabel('Evolutionary Distance')
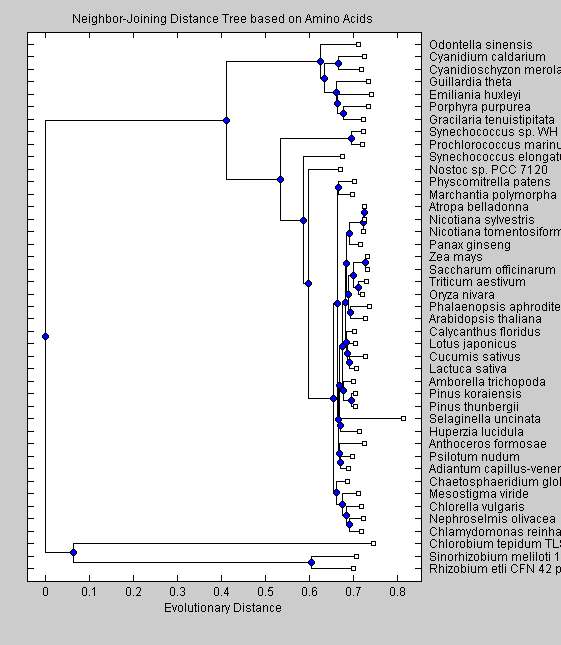
NJAATree = seqneighjoin(AAdist, 'equivar', SeqAA);
plot(NJAATree)
title('Neighbor-Joining Distance Tree based on Amino Acids')
xlabel('Evolutionary Distance')
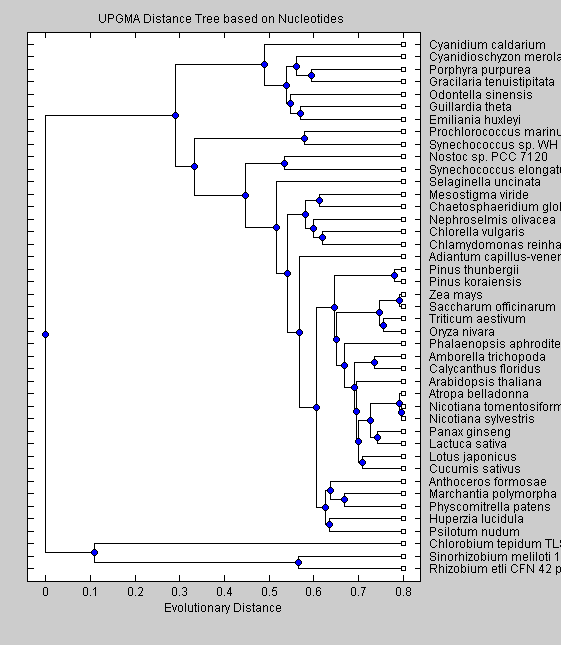
NTdist = seqpdist(All,'ALPHABET', 'NT');
NTUTree = seqlinkage(NTdist, 'UPGMA', All);
plot(NTUTree)
title('UPGMA Distance Tree based on Nucleotides ')
xlabel('Evolutionary Distance')
NJNTTree = seqneighjoin(NTdist, 'equivar', All);
plot(NJNTTree)
title('Neighbor-Joining Distance Tree based on Nucleotides')
xlabel('Evolutionary Distance')
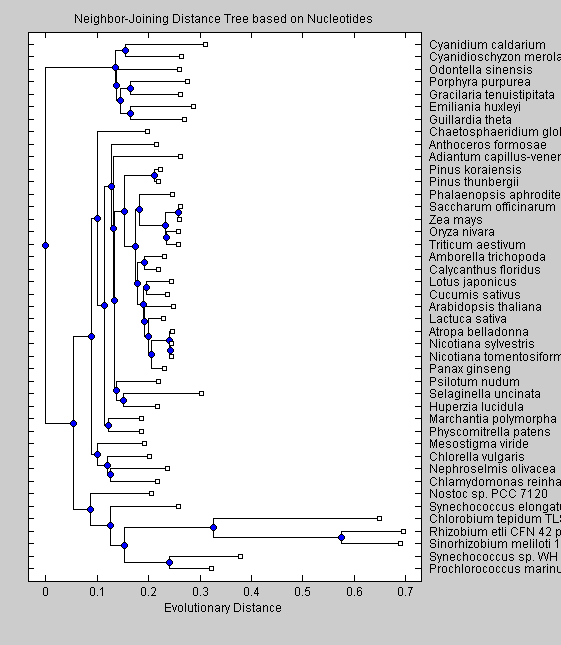
The trees obtained with nucleotide sequences group the non-green eukaryotes (C.merolae, P.purpurea, C.caldarium, O.sinensis, G.tenuistipitata, E.huxleyi) together on a branch separate from the cyanobacteria and green eukaryotes. This separation is seen also in the trees based on amino acid sequences. Moreover two cyanobacteria (Synechoccus sp. and P.marinus) are in a branch separate from the other cyanobacteria. The UPGMA algorithm put Nostoc sp. and S.elongatus as the closest cyanobacteria to greeen eukaryotes, while the neighor-joining algorithm resulted in Nostoc sp. being closer to the green eukaryotes. Among the green eukaryotes, green algae (C.globosum, M.viride, C.vulgaris, N.olivacea and C.reindhardtii) split early from the other green eukariotes. Our trees shows clearly that red algae, diatoms and cryptomonads altough they are similar in sequence characteristics, differ from green eukaryotes in the phylogenetic analysis. Moreover the neighbor-joining algorithm shows cyanobacteria as being closer to green eukaryotes than the red algae, diatoms and cryptomonads, suggesting that the chloroplast of these species arose from a different embdosymbiote than for green plants.
References
J.A.Raven, J.F. Allen. Genomics and chloropast evolution: what did the cyanobacteria ever do for plants?, Genome Biology 4:209(1)-209(5), 2003.
S.J. Giovannoni, S. Turner, G.J. Olsen, S. Barns, D.J. Lane, N.R. Pace. Evolutionary relationship among cyanobacteria and green chloroplasts. Journal of Bacteriology, 170:3584-3592, 1988.
J. De Las Rivas, J.J. Lozano, A.R. Ortiz, Comparative Analysis of Chloroplasts Genomes: Functional Annotation, Genome-Based Phylogeny, and Deduced Evolutionary Patterns, Genome Research 12, 567-583, 2002.