LAMBDAPHAGE Example of sequence statistics and segmentation with MATLAB
This demonstration looks at some statistics about the DNA content of the Lambda Phage and shows an example of segmentation of a sequence.
Contents
Introduction
Phages are viruses that infect bacteria, and Bacteriophage lambda infects the bacterium Escherichia coli, a very well studied model system. Bacteriophage lambda was the one of the first viral genomes to be completely sequenced (1982). It contains about 48502 bases. The Genome repository at the NCBI contains more interesting information about it.
web('http://www.ncbi.nlm.nih.gov/entrez/query.fcgi?db=genome&cmd=Retrieve&dopt=Overview&list_uids=10119');
The dna sequence can be obtained from the GenBank database with the accession number NC_001416. Using the getgenbank function with the ‘SequenceOnly’ flag just the nucleotide sequence is loaded into the MATLAB workspace.
BLambda = getgenbank('NC_001416','SequenceOnly',true);
If you don’t have a live web connection, you can load the data from a MAT-file using the command
% load BLambda % <== Uncomment this if no internet connection
The MATLAB whos command gives information about the size of the sequence.
whos BLambda
  Name          Size                    Bytes  Class

  BLambda       1x48502                 97004  char array

Grand total is 48502 elements using 97004 bytes
%The total length of the Bacteriophage Lambda genome is 48502 bp.
Change-point analysis
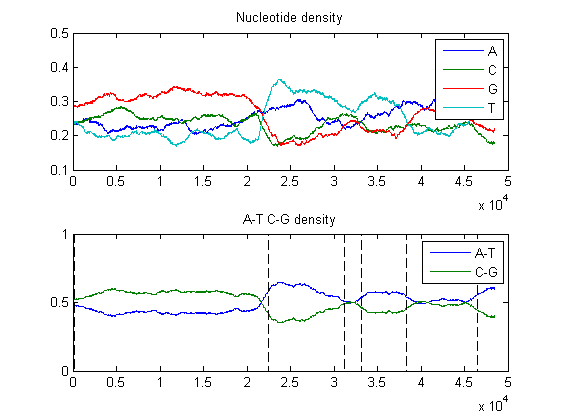
The local fluctuations in the frequencies of nucleotides provide interesting information. The local base composition by a sliding window of variable size can be measured. In the following the window size is assumed 2000 bp, 3000 bp and 4000 bp respectively.
ntdensity(BLambda,'window',2000)
ntdensity(BLambda,'window',3000)
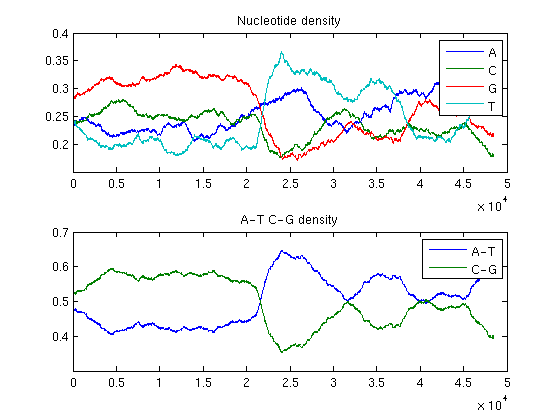
ntdensity(BLambda,'window',4000)
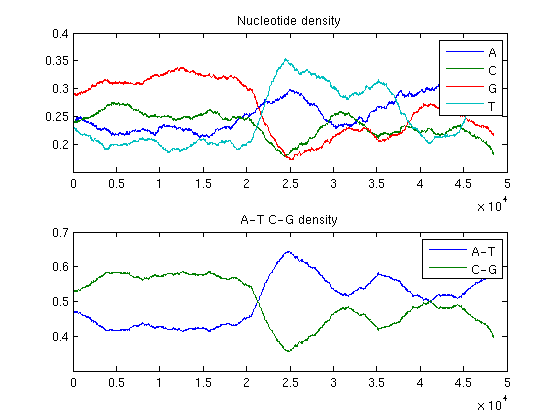
The analysis of the plots reveals that the phage genome is composed of two halves with completely different GC content: the first GC rich, the second AT rich. This is an example of change point in a genome.
Segmentation with Hidden Markov Model
You can use an HMM to segment the Lambda Phage genome into blocks of these two states. You can start generating random transition and emission matrices as input to the Expectation Maximization (EM) algorithm that better estimates those parameters.
T=rand(2,2);
E=rand(2,4);

% Normalize matrices

T(1,:) = T(1,:) ./ (norm(T(1,:),1));
T(2,:) = T(2,:) ./ (norm(T(2,:),1));
E(1,:) = E(1,:) ./ (norm(E(1,:),1));
E(2,:) = E(2,:) ./ (norm(E(2,:),1));
The nucleotide ‘A’, ‘C’, ‘G’, and ‘T’ are encoded by 1, 2, 3 and 4, respectively.
seq=nt2int(BLambda);


[estT, estE] = hmmtrain(seq,T,E);
With the Viterbi algorithm and the matrices previously calculated the sequence can be segmented.
estimatedStates = hmmviterbi(seq,estT,estE);
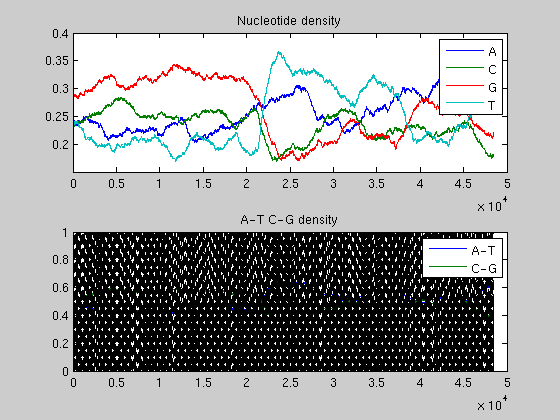
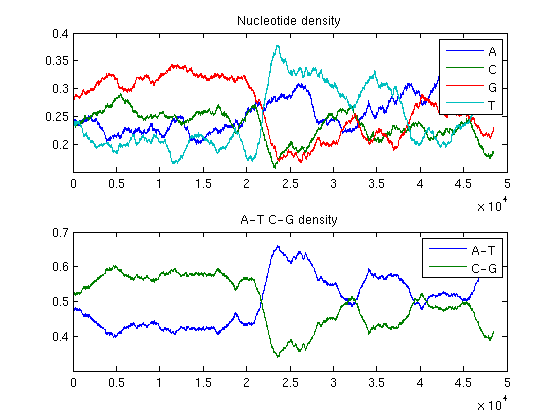
You can plot nucleotide density and change points together
ntdensity(BLambda);
hold on
plot(estimatedStates-1,'k--') % for visualization the states are coded as -1/1
hold off
Now you can compare this with the segmentation obtained with the initial guesses of matrices.
BADestimatedStates = hmmviterbi(seq,T,E);
figure
ntdensity(BLambda);
hold on
plot(BADestimatedStates-1,'k--') %for visualization the states are coded as -1/1
hold off