MAMMOTH Example of sequence comparison through genetic distance
Contents
Introduction
As shown in the case of the human example, many question about the origin and the evolution of humans can be answered with the analysis and the comparison of mithocondrial dna sequences. Here we examine the relationship between the ancient wooly mammoth and the African and Asian elephants. Wooly mammoth is an extinct specie which lived in the Ice Age. The African and Asian elephants are the closest relatives of these Ice Age giants. The phylogenetic relationship of the mammoth to the African and Asian elephants has been assessed only recently, thanks to the reconstruction of several complete mitochondrial genome sequences of wooly mammoth by use of multiplex polymerase chain reaction (PCR). A standard procedure in such analysis consists in considering the mitochondrial sequence, removing the hypervariable regions and comparing the remaining part. In this way we expect to discard the noisiest part and to have sufficient variation in the coding part of the genome. The genome sequence of wooly mammoth and modern African and Asian elephants can be obtained from the GenBank database with the MATLAB function getgenbank. Between all possible DNA sequences available we select just three.
mammoth=getgenbank('DQ188829','sequenceonly','true');

african=getgenbank('AJ224821','sequenceonly','true');

asian=getgenbank('NC_005129','sequenceonly','true');
If you don’t have a live web connection, you can load the data from a MAT-file using the command
%load mammoth % <== Uncomment this if no Internet connection
Statistical analysis
Before performing phylogenetic analysis, let us do some simple statistics of the sequences to see, if possible, some meaningful differences between them. First we can count the nucleotides and plot their density.
basecount(mammoth,'Chart', 'Pie');
title('Nucleotide composition')
figure
ntdensity(mammoth);
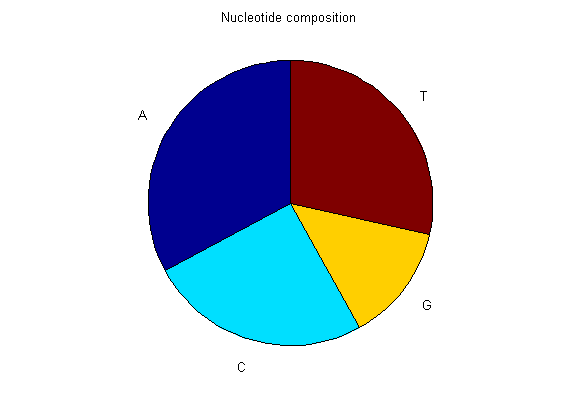
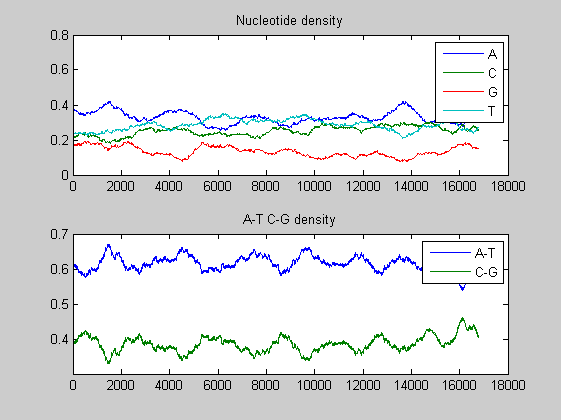
figure
basecount(african,'Chart', 'Pie');
title('Nucleotide composition')
figure
ntdensity(african)
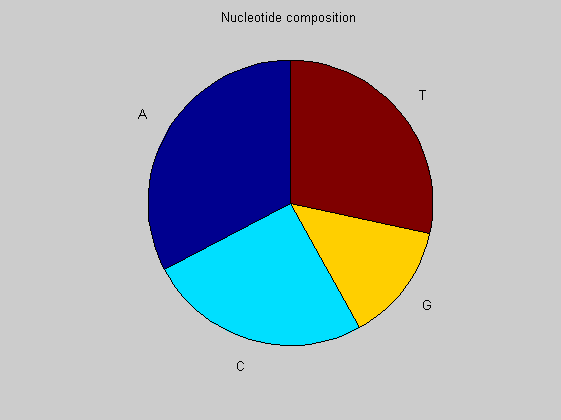
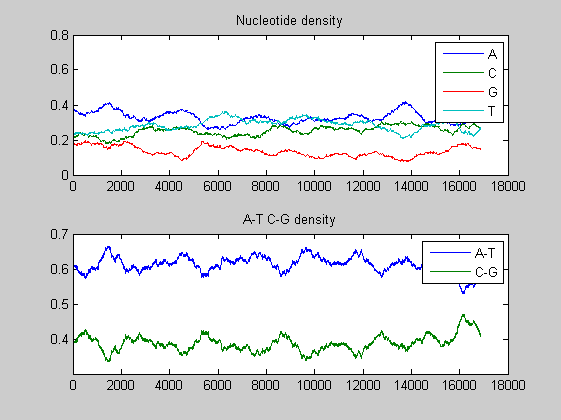
figure
basecount(asian,'Chart', 'Pie');
title('Nucleotide composition')
figure
ntdensity(asian)
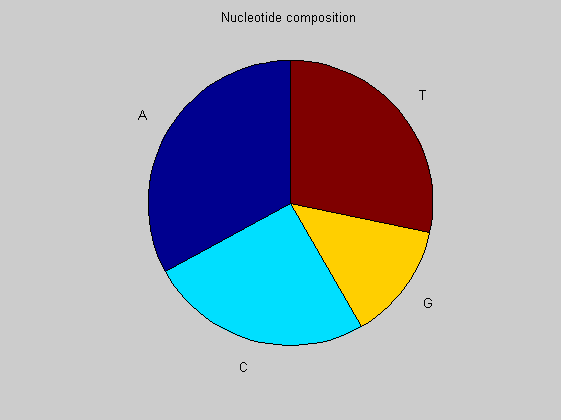
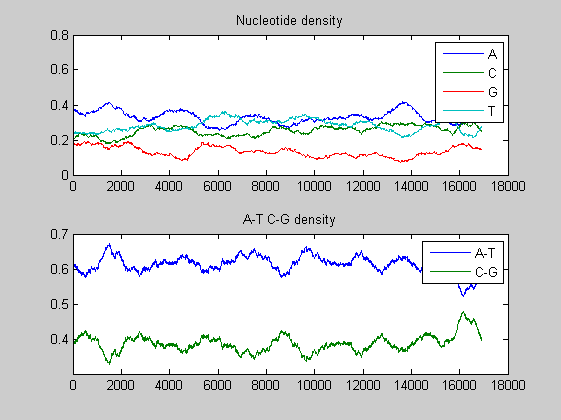
There is no significant difference between the three animals.
Analysing ORFs
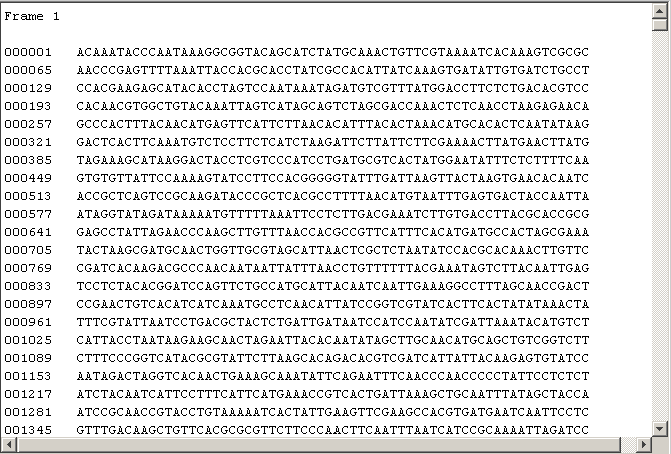
We perform ORF analysis to examine all ORFs of the sequences and to determine the minimum reliable ORF length by permutation testing. We assume significant ORFs those with length equal to or greater than the top 5% of random ORFs.
mrnd=mammoth(randperm(length(mammoth)));
orf=seqorfs(mrnd,'MINIMUMLENGTH',1);
ORFLength=[];
for i=1:3
    frameStop=orf(i).Stop;
    frameStart=orf(i).Start;
    frameStart=frameStart(1:length(frameStop));
    ORFLength=[ORFLength; (frameStop-frameStart)'];
end
empirical_threshold=prctile(ORFLength,95)
orf=seqshoworfs(mrnd,'MINIMUMLENGTH',empirical_threshold/3);
empirical_threshold =

  154.9500

afrnd=african(randperm(length(african)));
orf=seqorfs(afrnd,'MINIMUMLENGTH',1);
ORFLength=[];
for i=1:3
    frameStop=orf(i).Stop;
    frameStart=orf(i).Start;
    frameStart=frameStart(1:length(frameStop));
    ORFLength=[ORFLength; (frameStop-frameStart)'];
end
empirical_threshold=prctile(ORFLength,95)
orf=seqshoworfs(mrnd,'MINIMUMLENGTH',empirical_threshold/3);
empirical_threshold =

  146.1000

asrnd=asian(randperm(length(asian)));
orf=seqorfs(asrnd,'MINIMUMLENGTH',1);
ORFLength=[];
for i=1:3
    frameStop=orf(i).Stop;
    frameStart=orf(i).Start;
    frameStart=frameStart(1:length(frameStop));
    ORFLength=[ORFLength; (frameStop-frameStart)'];
end
empirical_threshold=prctile(ORFLength,95)
orf=seqshoworfs(mrnd,'MINIMUMLENGTH',empirical_threshold/3);
empirical_threshold =

  146.5500
As before, these results shows the similarity between the three species.
Phylogenetic analysis
To perform phylogentic analysis we decide to exclude the Dloop from the sequences as explained above. The obtained sequences are used as input to the MATLAB function seqpdist
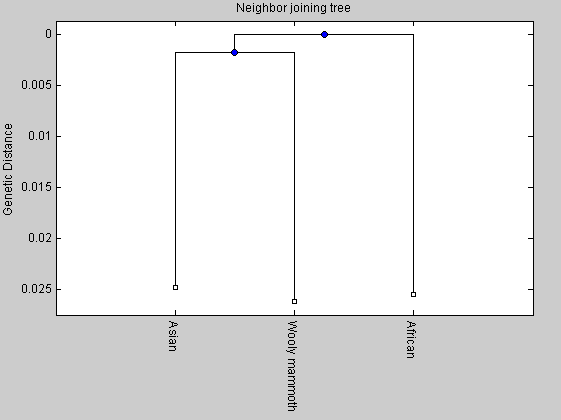
elephants(1).Sequence=mammoth(1:15421);
elephants(1).Header='Wooly mammoth';
elephants(2).Sequence=african(1:15417);
elephants(2).Header='African';
elephants(3).Sequence=asian(1:15419);
elephants(3).Header='Asian';
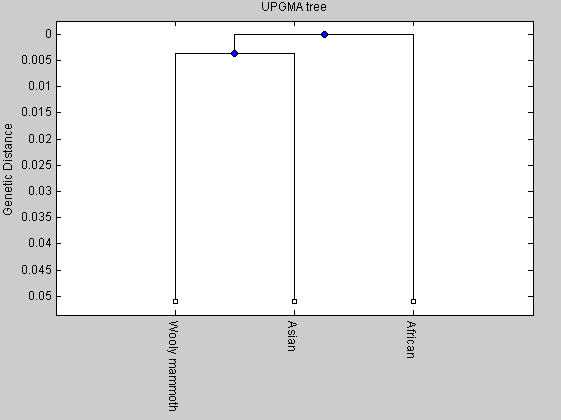
We compute the distance matrix with the Jukes-Cantor correction. Note that the distance computations in the following are very time consuming and could run out of memory. Therefore the distance value are also given
%distances = seqpdist(elephants,'Method','Jukes-Cantor','alphabet','NT');
distances=[0.0517 0.0474 0.0503];

tree2= seqlinkage(distances,'UPGMA',elephants);
plot(tree2,'orient','bottom');
title('UPGMA tree')
ylabel('Genetic Distance')


NJtree = seqneighjoin(distances,'equivar',elephants);
plot(NJtree,'orient','bottom');
title('Neighbor joining tree')
ylabel('Genetic Distance')
Global alignment
We perform also global alignment between each pair of the two elephants to see if some useful innformation can be extracted from this. As above, due to the length of the sequence, the global alignment could run out of memory.
% [s1, a1]=nwalign(mammoth, african);
% [s2, a2]=nwalign(mammoth, asian);
% [s3, a3]=nwalign(african, asian);
Observing the score of the alignments (s1=38792, s2=39065, s3=39085) we see that none is significantly greater that other pair of sequences. Therefore only phylogenetic analysis seems to be useful for investigating the relationship between the mammoth and the modern elephants.
Phylogenetic tree of primates
To aim of comparison, we plot the phylogenetic tree also for human, chimpanzee and gorilla.
human=getgenbank('DQ301816','sequenceonly','true');
chimpanzee=getgenbank('X93335','sequenceonly','true');
gorilla=getgenbank('NC_001645','sequenceonly','true');
As before we eliminate the D-loop sequences, which have high mutation rate, from the complete sequences when computing Jukes-Cantor distance from each pair of mtDNA sequences.
primates(1).Sequence=human(579:16027);
primates(1).Header='human';
primates(2).Sequence=chimpanzee(1:15448);
primates(2).Header='chimpanzee';
primates(3).Sequence=gorilla(1:15446);
primates(3).Header='gorilla';

%distances2 = seqpdist(primates,'Method','Jukes-Cantor','alphabet','NT');
distances2=[0.0906 0.1135 0.1084];


tree2= seqlinkage(distances2,'UPGMA',primates);
plot(tree2,'orient','bottom');
title('UPGMA tree')
ylabel('Genetic Distance')


NJtree = seqneighjoin(distances2,'equivar',primates);
plot(NJtree,'orient','bottom');
ylabel('Genetic Distance')
title('Neighbor joining tree')
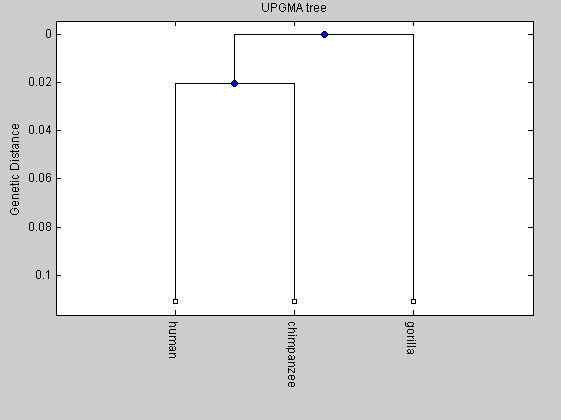
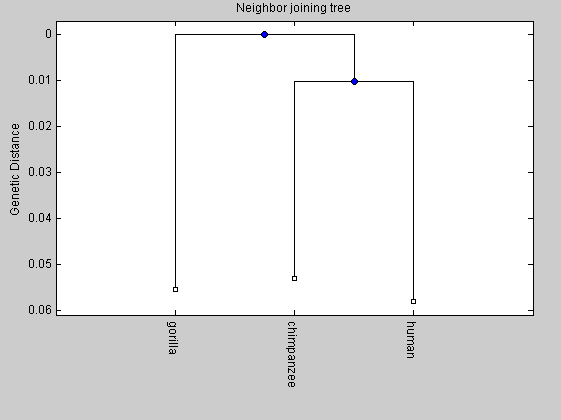
From the comparison between the two trees we can observe that the length of the internal branch for the elphants tree is shorter than that of the primates tree. It means that the time for the divergence between the mammoth and the Asian elephant has been shorter than that of the divergence between human and chimpanzee.
References
J. Krause et al, Multiplex amplification of the mammoth mitochondrial genome and the evolution of Elephantidae. Nature, Vol 439, 2006.